Building an Agent Sandbox from Scratch (Part 2)
Part 2 of the sandbox series: observability, plan mode, self-repair, browser verification, and the runtime changes that made the system trustworthy.
Part 1 got me to an important milestone: task in, PR out.
That was enough for a demo. It was not enough for something I could trust.
The sandbox could already spin up a disposable environment, run an agent, and produce code. But the moment something went wrong, the whole system turned opaque. The agent might hang, misunderstand the task, or ship broken code, and I would only find out after the run was over and the budget was already spent.
This post is about everything I had to add after the core runtime worked: visibility, review gates, repair loops, browser verification, richer outputs, and a configuration system that makes those capabilities opt-in instead of bolted onto every project.
Cracking open the black box#
The first prototype used Claude Code as the inner agent because it let me focus on the container mechanics first. That was the right shortcut at the time, but it came with a real limitation: at the end of a run I basically got a blob of stdout and stderr.
That is the core problem with a black-box agent. By the time you know something went wrong, the money is already gone.
Moving to OpenCode changed that. opencode run --format json emits newline-delimited JSON events as the session runs, so the harness can track progress in real time instead of doing log archaeology afterwards.
{
  "type": "step_finish",
  "timestamp": 1710547201000,
  "part": {
    "reason": "end_turn",
    "cost": 0.0042,
    "tokens": {
      "input": 1000,
      "output": 400,
      "reasoning": 100,
      "cache": { "read": 500, "write": 200 }
    }
  }
}
That one change bought me a lot:
- Live step-by-step progress
- Tool call visibility
- Token usage and cost while the run is still in flight
- Better failure diagnostics
- Structured data that can flow into
result.jsonand PR metadata later
Under the hood, the implementation stayed simple. I did not need a complicated async runtime here. subprocess.Popen with threaded readers turned out to be enough: one thread consumes stdout and parses events, another watches stderr, and the main thread enforces deadlines.
The watchdog#
Once the runner had structured events, it also had a heartbeat.
Every model step and every tool call emits output. If no events arrive for a while, that absence is meaningful. The harness now treats 180 seconds of silence as a hang, kills the process, and writes a diagnostic instead of waiting for the full container timeout.
inactivity timeout after 180s
last_event_type: text
current_step: 6
completed_steps: 5
cost_so_far: $0.07
That immediately paid off. It exposed a real OpenCode edge case: its built-in planning agent could hang when combined with JSON streaming, because the final text-only response never emitted the completion event the runner was waiting for.
Review before you spend#
Streaming solved observability during a run. The next problem was observability before a run.
In the first version, the agent started editing code immediately after it received the task. That works for small changes, but it is much less reliable for anything architectural, ambiguous, or multi-step. If the agent chooses the wrong approach early, it can burn most of the budget before anyone notices.
The obvious answer is plan-and-execute: let the agent explore first, show the human the approach, then only execute after approval.
The sandbox now does exactly that in two phases.
Phase 1 is read-only. The agent receives a prompt that tells it to observe its environment, understand the task, and produce a detailed implementation plan. It can use the browser, inspect files, and call tools to gather context, but it cannot make any changes. Once the plan is ready, it's extracted from the event stream and presented to the user.
You are in PLANNING MODE. Your job is to observe your environment and produce an implementation plan. DO NOT modify any files — only read and analyze.
After reading the relevant files, output a clear, structured plan in markdown that covers:
1. What files need to be created or modified
2. The specific changes for each file
3. Testing strategy
4. Any edge cases or risks
Here is the task:
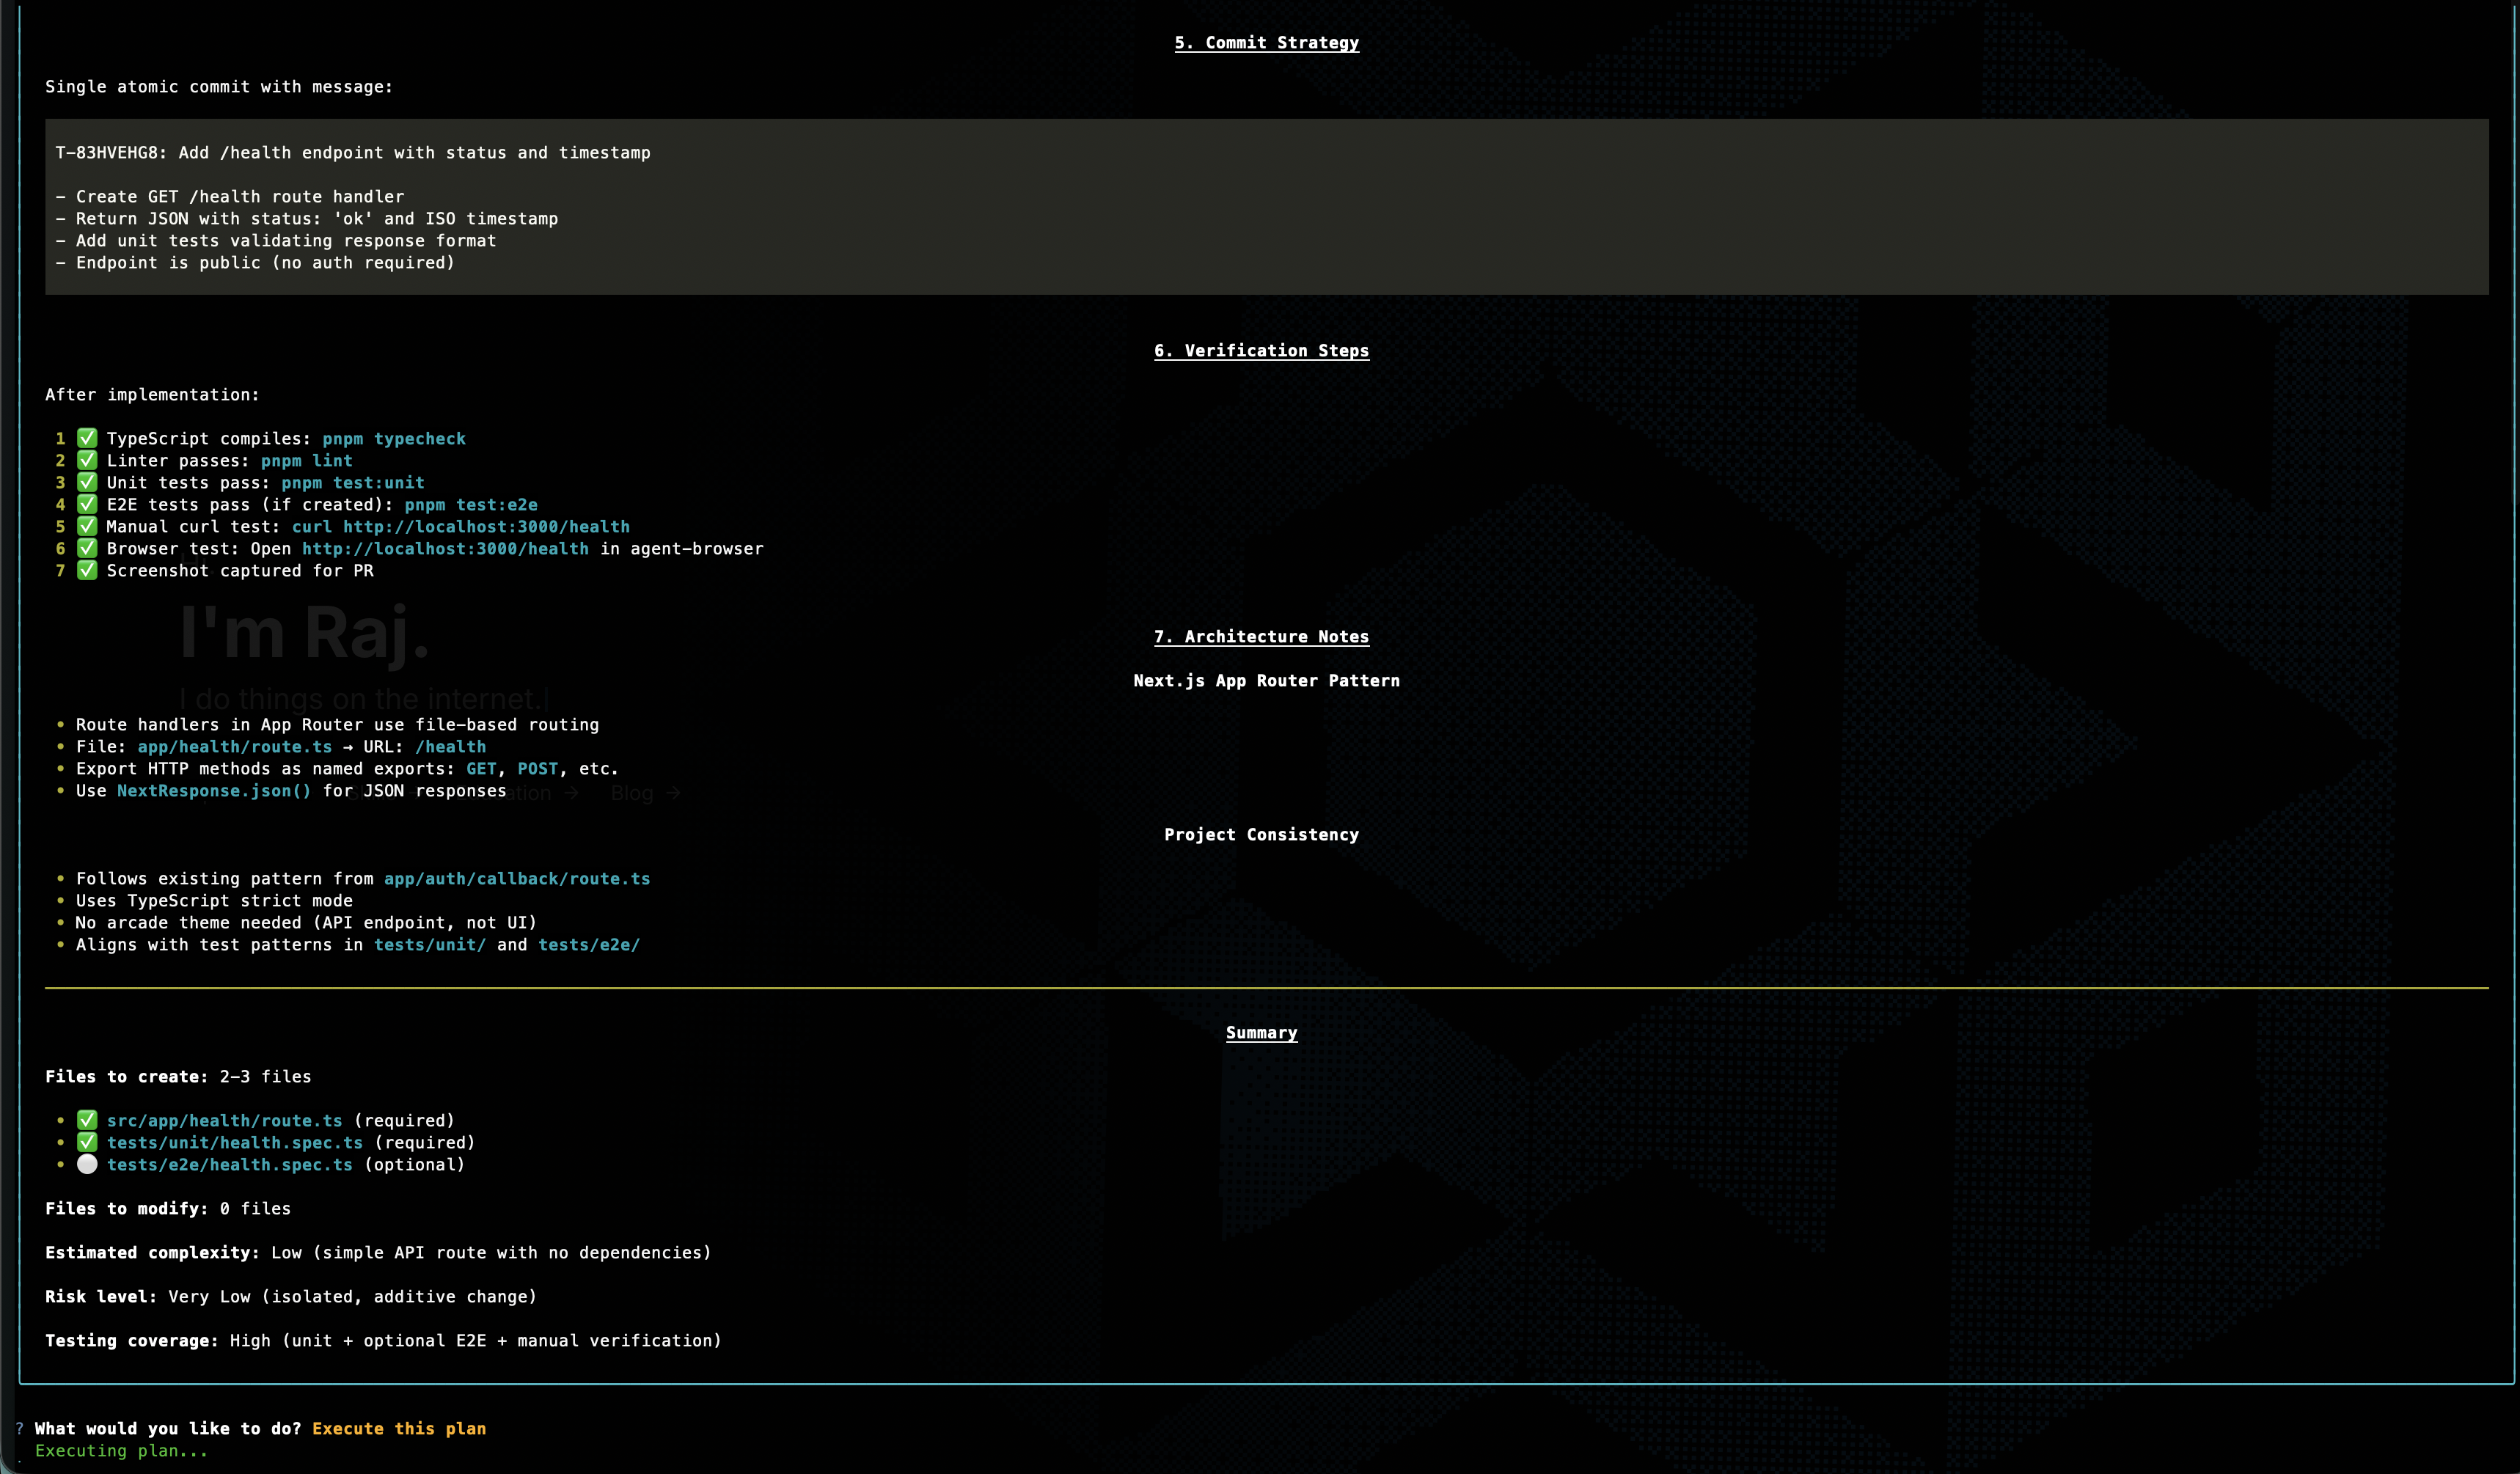
...Phase 2 is interactive. The host CLI renders the plan as rich markdown in the terminal and gives you a choice: execute it, revise it, or abort. If you provide feedback, the agent revises the plan in the same session (up to five rounds), preserving the context it already built up. Once the plan looks right, the runner continues that same session into execution.
This is one of those features that looks expensive until you compare it to the alternative. Planning usually costs a small fraction of the total run, while blindly executing the wrong plan can waste the entire budget. The point is not to make the sandbox slower. It is to spend a little upfront so the rest of the run has a much better chance of succeeding.
If there is no interactive terminal, the current behavior is to auto-execute after planning and include the plan text in the run output for auditability. In the future, I'm planning for that review step to route to the right place automatically, whether that is a terminal, Slack, or some other approval surface.
Let the sandbox repair cheap mistakes#
After the agent finishes its main task, the sandbox runs validation checks. For a coding task that usually means tests, lint, and typecheck.
Originally, any validation failure killed the whole run. That turned out to be wasteful.
If the agent already has the full context of the task and the broken code it just wrote, it should get one more chance to fix the easy stuff. Most validation failures are not deep design problems. They are things like a missing import, a wrong file name, or a type error that slipped through.
The runner now sends only the failing checks back to the agent in the same session and gives it up to two repair attempts.
Validation failed (1/2). Fix the following errors and commit your changes:

### lint FAILED
...
A few guardrails keep this from turning into runaway spending:
- Only retry if the main task itself succeeded
- Only include the checks that failed
- Cap the repair budget at 20% of the original run budget, with a minimum of $1
- Keep the repair work in the same session so the agent still has the full context
That last part matters. A fresh agent would need to rediscover the whole situation. A continued session can usually fix the problem with much less prompting.
Give the agent eyes#
Agents are good at symbolic work. They are much worse at answering questions like “does this actually look right?”
That matters more than it sounds. If the task is “add a loading spinner to the users page,” the agent may know exactly which file to edit, but without a browser it still cannot verify whether the spinner renders, whether it is aligned correctly, or whether the mobile layout broke in the process.
Now the sandbox gives the agent browser access whenever the project actually has a dev server configured.
The important design choice here is that the browser has two different modes of seeing:
| Mode | Best for | Why it exists |
|---|---|---|
| Structured snapshot | content, layout structure, clickable elements, forms | cheap, machine-readable, easy for the agent to act on |
| Screenshot + image read | colors, spacing, alignment, responsiveness | more expensive, but necessary for visual verification |
A structured snapshot looks something like this:
Page: http://localhost:3000/users
@e1 heading "Users"
@e2 textbox "Search users"
@e3 button "Invite user"
@e4 table "Alice, Bob, Carol"
That is ideal for structural verification. The agent can reason about the page and interact with it by reference instead of guessing from pixels.
When the task is visual, the agent switches to screenshots. It captures an image, then reads the image file back in so it can inspect the actual result. That closes the gap between “the code looks plausible” and “the UI actually looks right.”
That same media also helps human reviewers. If the PR includes screenshots or a short demo, a reviewer can understand the outcome without pulling the branch locally.
Make the PR tell the story#
A good diff tells you what changed. It does not always tell you what happened.
That is especially true for UI work. If the sandbox is going to open a PR on its own, the PR should carry enough evidence that a human can review the outcome without reconstructing the whole run.
So the sandbox now bundles a few extra artifacts into the output:
- Screenshots for static visual checkpoints
- Short recordings for interactive flows
- A 2-4 sentence summary written by the agent itself
- Cost and step metadata pulled from the event stream
The result is a PR body that reads more like a receipt than a mystery:
## Summary
Added cursor-based pagination to the users API and updated the dashboard list view to match.
## Screenshots

## Recordings

## Metadata
- **Cost**: $0.1234 (42 steps)The media pipeline is also set up to fit GitHub's rendering constraints. Recordings are captured as WebM during the run, then converted to animated WebP for inline display in the PR. Screenshots and recordings are committed on a media commit so the PR can reference permanent URLs, then cleaned up from the branch tip so they do not linger in the working tree forever.
The smaller but surprisingly useful addition is cost. Once you can see dollars and steps directly in the PR, it becomes much easier to compare runs and ask whether the expensive ones were actually worth it.
Make the sandbox fit the project#
One of the fastest ways to ruin an agent system is to hand every project the same giant prompt and the same pile of tools.
Different projects need different capabilities. A Next.js app might want browser tooling and devtools. A Supabase-heavy project might want a Supabase MCP server. A backend service may not need browser instructions at all.
In order to accommodate them all without turning the sandbox into a junk drawer, the configuration system now allows for per-project specification of both skills and MCP servers.
For those not familiar with the terminology:
- Skills are reusable instruction packs that teach the agent how to use a tool or workflow well.
- MCP servers are live tool endpoints the agent can call at runtime.
That configuration lives in the project config:
mcp:
  supabase:
    type: local
    command: ['npx', '@supabase/mcp-server']
    environment:
      SUPABASE_ACCESS_TOKEN: '${SUPABASE_TOKEN}'

skills:
  - bundled:agent-browser
  - github:internal-org/tools:linter
  - ./tools/my-custom-skill
The practical outcome is simple: projects only get what they need.
If a repo has no dev server, the browser instructions never appear. If it does not need Supabase, there is no Supabase MCP setup in the prompt. The sandbox stays adaptable without turning into a junk drawer.
Config layering#
There is also a second half to this story: where configuration comes from, and how overrides work.
Part 1 introduced the project YAML as the contract between the CLI and the container. Part 2 adds the layering that makes that contract workable for both teams and individuals.
That gives you a useful split of responsibilities:
- The repo carries team defaults
- The host project config carries personal overrides
- The global config carries cross-project preferences
- The CLI handles one-off changes for a single run
Environment variables go through a similar resolution chain: YAML defaults, then .env, then .env.local, then ${VAR} references from the host shell, and finally --env-file as the last override. Infrastructure placeholders like {supabase_kong} get resolved at runtime so multiple sandboxes can run concurrently without stepping on each other.
The whole point is predictability. People should be able to understand why a run had the model, budget, secrets, and tools that it had.
Beyond coding tasks#
Up to this point, most of the story has assumed a coding workflow: clone a repo, change code, validate it, and open a PR.
Not every useful agent task looks like that.
Research, scraping, competitor analysis, and browser-driven operational work still benefit from isolation, but they do not need a nested Docker daemon, a repo checkout, or a full app stack. Running the full coding sandbox for those tasks is like renting a warehouse to store a backpack.
That is what task mode is for.
sandbox-agent task \
  --task "Research competitor pricing for project management tools" \
--config research-agent| Coding mode | Task mode | |
|---|---|---|
| Docker daemon | Yes (DinD) | No |
--privileged | Required | Not needed |
| Services | Supabase, Redis, custom infra | None |
| Git clone | Yes | No |
| Browser | If configured | Always available |
| MCP servers | If configured | If configured |
| Output | GitHub PR | Structured result artifacts |
| Init pipeline | 9 steps | 3 steps |
The unlock here is dropping --privileged. Without it, task mode can run in environments that would reject the full DinD stack outright. The sandbox stops being only a coding runtime and starts looking more like general-purpose infrastructure for isolated agent work.
Task results still land in a structured output directory, with the same basic metadata around duration, cost, and artifacts. The main difference is that there may be no repo, no PR, and no diff stats because the output is something else entirely.
Three smaller fixes that mattered#
These changes are less glamorous than plan mode or browser verification, but they are the kind of things that separate a neat demo from a runtime you can actually keep using.
- Service health checks replaced the old
sleep 3approach with real probing: TCP ports, HTTP endpoints, and command-based checks running in parallel. The sandbox starts faster and fails in more understandable ways. - Shared Docker and package-manager caches avoid re-pulling images and re-downloading dependencies on every run. Locally, that saves minutes.
- Permission handling got smarter. OpenCode can auto-reject some operations in headless mode, so the runner now detects those stalls from stderr, explains what was rejected, and gives the agent one more pass with better instructions.
Those are not flashy features. They are just the kind that quietly remove a lot of friction.
Every run leaves behind a receipt#
The sandbox is still ephemeral. The container starts, does its work, writes its outputs, and disappears.
What stays behind is the receipt.
{
  "task_id": "T-A1B2C3D4",
  "status": "completed",
  "duration_seconds": 127,
  "token_usage": {
    "total_cost_usd": 0.1234,
    "steps": 8
  },
  "validation": {
    "test": { "passed": true },
    "lint": { "passed": true }
  },
  "screenshot_paths": ["users-page.png"],
  "recording_paths": ["pagination-demo.webm"],
  "pr_summary": "Added cursor-based pagination..."
}
The real result.json includes more detail than that, such as token breakdowns, validation output, diff stats, and task-mode summaries. The important part to focus on isn't the schema, but rather the fact that every run now leaves behind structured evidence of what happened, how long it took, what it cost, and what it produced.
What's still missing is aggregation.
Right now each run writes its own receipt, but there is no higher-level view showing success rates by project, common failure modes, or where time and budget are actually going. That is the next operational layer: a dashboard built on top of these results instead of a pile of individual JSON files.
What's next: from sandbox to fleet#
Part 1 was about building a disposable runtime. Part 2 was about making that runtime transparent, steerable, and much easier to trust.
Compared to where I left off in Part 1, the sandbox is no longer just “agent in, PR out.” It can:
- Show me what the agent is doing while it runs
- Kill hung sessions before they waste the whole budget
- Ask for approval before execution
- Retry cheap validation failures in the same session
- Verify UI work with a browser
- Attach artifacts that make PRs easier to review
- Scale its own capabilities up or down depending on the project.
At this point, I think the single-machine version is feature-complete enough to be genuinely useful.
What it is not yet is a fleet.
That is Part 3: taking this from a local runtime to a cloud-native system that can dispatch work across many sandboxes at once, surface live metrics, and operate like a service instead of a tool. The interesting problems there are less about the agent itself and more about orchestration, queues, dashboards, and failure handling at scale.
That is where the sandbox gets promoted from environment to infrastructure.